Mobile app KPIs are the only way to understand whether ASO is actually working. We often see teams that treat optimization as a one-time task: they collect the semantic core, update the page, and then forget about it. Six months later, traffic drops, rankings slip, and competitors are already at the top.
However, ASO does not end at publication. The app page is a living tool that evolves together with store algorithms, user behavior, and market trends. It is impossible to maintain it blindly.
That is why we rely on data. Only data shows whether a hypothesis worked, whether a new icon brought more installs, and whether entering a new market paid off. ASO without measurement is just an opinion. With measurement, it becomes a strategy.
Metrics vs KPIs: What Is the Difference?
We are used to thinking that any numbers in a dashboard are already KPIs. This is the first and most dangerous trap. In reality, metrics and key performance indicators are different things.
Metrics are raw data: impressions, installs, uninstalls, and sessions. They answer the question “how many?” and, by themselves, they do not say anything about success. Ten thousand installs—is that a lot or a little? It depends on what goal we set.
KPIs are metrics tied to a business objective. They answer not “how many?”, but “how well?”
For example, installs are just a metric. But the conversion from a store page view to an install (CR) becomes a KPI if our goal is to improve the app page's efficiency. In the same way, keyword positions are just numbers, but the share of keywords in the top 10 is already a KPI when we are working on visibility.
| Metric | KPI |
| Installs | Achievement of the plan for organic installs |
| Positions | Share of keywords in the top 10 |
| Impressions | Growth in impressions without a decline in CR |
The difference is managerial. We observe metrics. We set KPIs and achieve them.
What Goals Does ASO Solve Today?
In the past, ASO was often reduced to one task: improving rankings. The higher, the better. But over the last couple of years, the app page has turned from a table of keywords into a full-fledged marketing channel. And the goals have changed. We analyzed exactly how the role of ASO has changed and which trends define it today in a separate article about ASO in 2026.
Today, ASO works in three directions simultaneously. It is important to separate them because each one requires its own metrics, tools, and strategy.
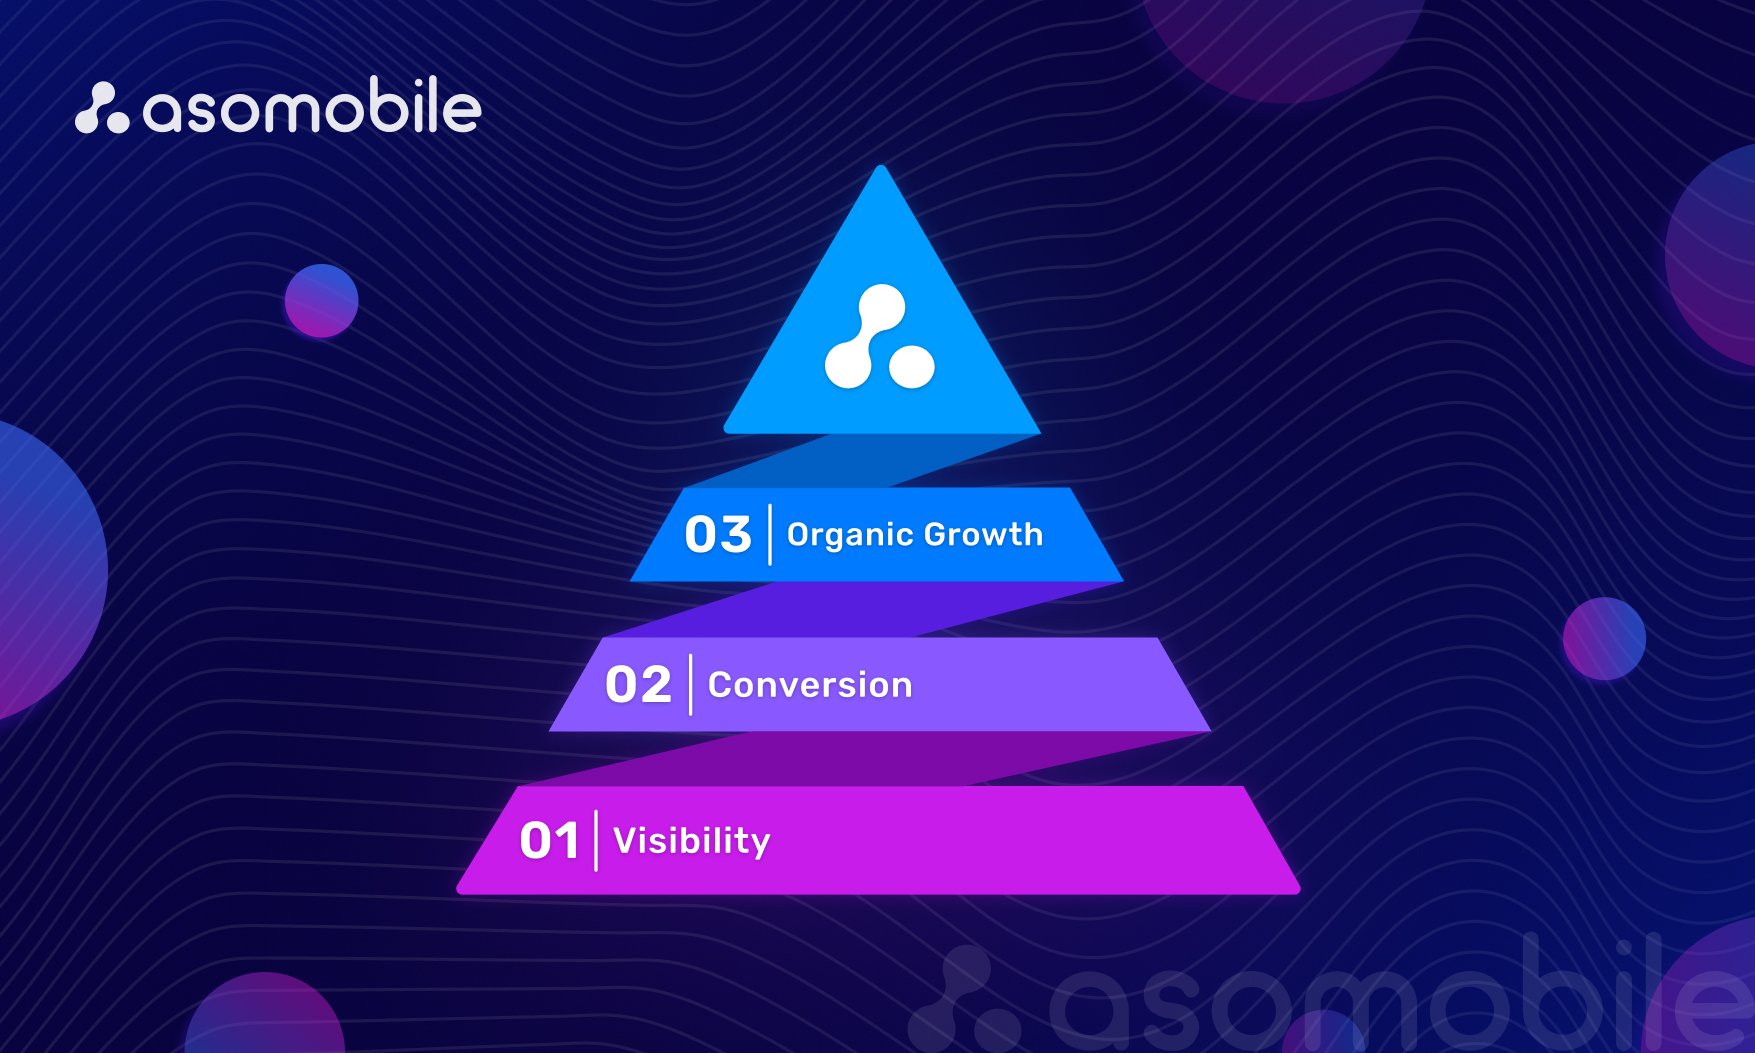
1. Visibility (Visibility)
The first and most basic goal is to ensure the app can be found at all. Without this, all other efforts are meaningless. Here we work with keyword search rankings, the indexation of our semantic set, getting into collections and trends. The goal is to take a noticeable place in search results and store categories.
2. Store Page Conversion (Conversion)
When the user has found us, we need to convince them to install the app. This is a separate engineering task: the icon, screenshots, video, description, and A/B tests. Here, we measure Conversion Rate (CR) and explore ways to turn a page view into an install. Visibility without conversion is just wasted traffic.
3. Organic Growth (Organic Growth)
The highest level is when ASO starts bringing installs without direct advertising investment. This is not only about search, but also about store recommendation systems, viral effects, and branded queries. Organic growth is an indicator that the product and its store page work as a single unit, attracting users in a cyclical pattern rather than as a one-time spike.
These three goals do not exclude each other. Moreover, they form a natural hierarchy: without visibility, there is no conversion, and without conversion, there is no organic growth. However, priorities depend on the app's stage. A newcomer needs to build visibility first, while a mature product should focus on conversion and retaining organic traffic.
The Main ASO KPIs
To manage ASO consciously, we выделяем four groups of key indicators. Each group answers its own question about the storefront's health and helps you make specific decisions.
Visibility in Stores: How Easy Is It to Find Us?
Visibility is the foundation. If the app is not shown in search and categories, all other efforts are rendered meaningless. Here we track several layers.
Keyword positions.
We regularly check our progress on the main queries in our semantic core. Not only the top 3 matters, but also the dynamics: is the position growing or falling? For this, we use specialized services (which we will discuss later). A drop, even for a secondary keyword, can signal indexing issues or increased competition.
Semantic indexation.
It is not enough to compile a list of keywords—you need the store to index them. We periodically check how many queries from our core the app is actually ranking. Loss of indexation is often associated with technical errors or unsuccessful metadata updates.
Ranking in the top charts and categories.
This is an indicator of mass interest. Getting into general or genre charts brings a powerful influx of organic traffic, but it requires high popularity. Nevertheless, we track category positions—they can grow even without sharp download spikes if algorithms see user engagement.
Featuring collections.
Being highlighted by the store editorial team is a separate visibility KPI. Although we cannot directly influence editorial choices, a high-quality page and regular updates increase the chances. We record appearances in collections as events and account for their impact on installs.
App Store Page Conversion
When the user has found us, we need to turn a view into an install. This is the area of responsibility of conversion metrics.
CR (Conversion Rate) is the percentage of page views that end with an install.
This is the base metric of page efficiency. We calculate it separately for different traffic sources (search, recommendations, direct visits). CR usually depends strongly on the category, but dynamics matter: if CR is falling while traffic is stable, we look for a problem with the storefront.
Effectiveness of the icon, screenshots, and video.
Each page element affects conversion. We do not just assume that the icon is “pretty”; we run A/B tests or at least compare performance before and after a change. Screenshots should not only show the interface, but also demonstrate value—this can be measured via behavioral metrics (e.g., the depth of viewing in the screenshot gallery).
A/B testing.
This is not a metric, but a tool; without it, it is impossible to objectively evaluate changes. We test hypotheses: a new icon versus the old one, a different order of screenshots, and different headlines. The main KPI in a test is a statistically significant growth in CR. Without that, any changes are guesswork.
Ratings and Reviews
Reputation in the store affects both the user’s decision and ranking algorithms.
Average rating.
A simple and important metric. We monitor the overall score and its dynamics. A sharp drop in rating is a signal of product issues (bugs, dissatisfaction with a new version). A low rating reduces CR and positions.
Review dynamics.
It is important not only how many stars there are, but also how many reviews exist at all. Apps with a large number of ratings inspire more trust. We track review growth over time and encourage loyal users to leave feedback.
Working with negative feedback.
Replying to bad reviews is part of ASO. A fast, constructive response can neutralize negativity and sometimes even turn an unhappy user into a loyal one. In addition, algorithms take developer activity into account.
The impact of rating on search results.
There is a direct correlation: a high rating and many positive reviews help the app rank higher. Therefore, working with reputation is an investment in visibility.
Organic Installs and Growth
The ultimate goal of ASO is a stable flow of users without direct advertising costs.
Share of organic traffic in total acquisitions.
We compare installs from organic sources (search, store recommendations, direct visits) with paid installs. Growth in the organic share indicates healthy ASO. A decline may mean we have become too dependent on advertising, or that visibility has decreased.
Installs from search versus recommendations.
It is worth separating traffic from search (when the user searches for specific words) and from recommendation systems (similar apps and “You might also like” widgets). Search results are the result of our work with semantics, while recommendations are signals to algorithms about engagement and quality. Growth in recommendations indicates that users like the product.
Trending queries.
We track which new or growing queries the app has started to rank for. This helps us catch waves of interest and expand semantics in time. Sometimes an accidental попадание into a trend gives a spike in installs, and it is important to notice it.
App KPIs Without Which ASO Does Not Work
ASO brings users to the storefront. But the product decides whether they stay, pay, and return. Evaluating optimization efficiency without considering what happens after the install means seeing only half the picture. That is why, in our system, we always look at end-to-end metrics that connect acquisition, retention, and revenue.
Retention and Engagement
The user installed the app—what happens next? If they leave after one day, it means we either attracted the wrong audience or failed to fulfill the promise on the page. That is why retention is the main indicator of the quality of traffic delivered by ASO. We discussed in detail how to measure and improve retention in a separate article.
- Retention D1/D7/D30. We track how many users return the next day, after a week, and after a month. A low D1 often indicates onboarding issues or a mismatch between expectations and reality. A drop at D7–D30 signals that the product does not form a habit. Strong retention confirms that organic traffic is relevant.
- DAU/MAU. The number of active users per day and per month shows the scale of the audience. But the ratio between them is even more important.
- Stickiness (DAU/MAU). This coefficient answers the question “how embedded is the product in users’ lives?”. The higher the stickiness, the less we depend on a constant influx of new installs.
- Churn rate. The percentage of users who stopped using the app. High churn with growing organic traffic is a warning sign: the funnel is leaking deeper down, and new installs will not save it.
Monetization
The ultimate goal of most apps is revenue. ASO can drive thousands of installs, but if they do not pay off, the strategy must be reconsidered.
- ARPU / ARPPU. Average revenue per user (ARPU, for all users) and average revenue per paying user (ARPPU). A decline in ARPU while organic growth increases may mean we are attracting many “empty” users who do not monetize. The задача is to balance volume and quality.
- LTV (Lifetime Value). The projected revenue a user will bring over their entire lifetime. LTV must be higher than acquisition costs (CAC/CPI). If the LTV of organic users is lower than that of paid users, it means ASO is attracting the wrong audience.
- CPI / CAC / CPA. The cost per install (CPI), cost to acquire a customer (CAC), and cost per action (CPA). For organic traffic, these costs are formally zero, but we still compare organic LTV with these indicators to understand the effectiveness of investments in ASO specialists and tools.
- Marketing ROI. Return on investment across all acquisitions, including organic. We calculate it not only for paid campaigns, but also by evaluating how many resources were invested in ASO and what increase in installs and revenue it produced.
| Metric | What it measures | Why it matters for ASO |
| ARPU / ARPPU | Average revenue across all users (ARPU) and across paying users (ARPPU) | A decline in ARPU while organic share grows may mean we are attracting many “empty” users who do not monetize. We need to balance volume and quality. |
| LTV (Lifetime Value) | The projected revenue a user will bring over their lifetime | We calculate it not only for paid campaigns but also by assessing the resources invested in ASO and the increase in installs and revenue it delivered. |
| CPI / CAC / CPA | Cost per install (CPI), cost to acquire a customer (CAC), and cost per action (CPA) | Return on investment across all acquisitions |
| Marketing ROI | Return on investment across all acquisition | For organic traffic, these costs are formally zero, but we compare organic LTV against these metrics to gauge the effectiveness of ASO tool investments. |
Important: ASO brings users, but the product must bring revenue. If installs are growing but revenue is not, the problem is not ASO—it is monetization. However, we cannot ignore this connection.
User Experience
Even a perfectly tuned page will crash against technical problems. The user will not figure out who is to blame—developers or marketers. They will simply uninstall the app.
- Loading speed. The longer the app takes to start, the higher the drop-off in the first seconds. This is especially critical for users in regions with weak internet connections.
- Crashes. Failures and crashes are a direct path to negative reviews and a lower rating. We track the percentage of crash-free sessions and users’ reactions after updates.
- UX factors that influence churn. Unclear navigation, intrusive ads, and complicated registration—all of which increase churn. These metrics are harder to measure directly, but we look at behavioral factors (session depth, return frequency) and link them to interface changes.
All three groups of metrics—retention, monetization, and user experience—do not replace ASO indicators; rather, they complement them. Together they provide the full picture: not just “how many we brought,” but “who we brought and what happened to them.” This approach turns ASO from an isolated function into part of a system of app growth.
Common Mistakes When Measuring ASO Effectiveness
When you dive into ASO analytics, several traps await almost everyone. We collected the top 5 mistakes that are easier to prevent than to untangle later.
- Looking only at the number of keywords instead of positions.
You can be indexed for a thousand queries but sit in the 50th position, where there are almost no transitions. What matters is not how many keywords you have, but how many you are in the top 10 or top 3. Without this, the metric “number of keywords” becomes a meaningless reporting metric.
- Not analyzing the connection “traffic → conversion → installs”.
We often see teams celebrating growth in impressions. But if CR is falling at the same time, installs may stay flat or even decrease. These metrics must be analyzed together: traffic (impressions) → conversion to install (CR) → final installs. Impressions can grow due to irrelevant traffic that converts poorly. Or CR may fall because screenshots are outdated. Without the connection, it is easy to mistake noise for a signal.
- Changing everything at once.
You changed the icon, screenshots, description, and title—and got a spike in installs or a drop. But what exactly worked? It is unclear. Because of this, it becomes impossible to scale success and learn from failures. We try to test hypotheses one by one: first, the icon, record the result, then the next element.
- Ignoring seasonality and the market.
In December, installs grow for everyone—this is not ASO’s заслуга. In January, they fall—this is not necessarily a failure either. Without an adjustment for seasonality and overall market trends (for example, changes in store algorithms), it is easy to draw the wrong conclusions. We always compare dynamics relative to competitors and consider the calendar: holidays, vacations, and industry events.
How to Build an ASO Measurement System Step by Step
Understanding metrics is only half the job. The main thing is to build a working system from them—one that helps you make decisions rather than just collecting dust in dashboards. We use a simple step-by-step algorithm.
Step 1. Define the priority goal
You cannot improve everything at once. At different stages of an app’s life cycle, the tasks change. For a new product, visibility is more important (boosting rankings). For a mature product, store page conversion and organic growth matter more. Choose one direction: visibility, conversion, or organic retention. This will become the focus for the next 1–2 months.
Step 2. Select 3 to 5 key KPIs
Each goal has its own indicators. If the focus is visibility, we track ranking dynamics for the core, the share of keywords in the top 10, and indexation. If the focus is conversion, we track CR, A/B test results, and rating impact. If the focus is on organic growth, we track the organic share, installs from recommendations, and growth from trending queries. It is difficult to control more than 5 KPIs—they start to produce noise.
Step 3. Measure the current “before” values
Before any change, we фиксируем the baseline. For example: positions for the top 20 queries as of today, CR for the last 2 weeks, the current organic share. This is needed so that later we can honestly answer: did it get better or not?
Step 4. Make changes and test iteratively
Change one element at a time. Or run an A/B test if the platform allows it. Give the change time to accumulate data (at least one to two weeks to collect statistics), and only then evaluate the result.
Step 5. Compare “after” and draw conclusions
Check how the selected KPIs changed. If it worked, record the hypothesis and think about how to scale it. If it did not, analyze why: maybe seasonality interfered, or store algorithms changed.
Step 6. Track the impact on product metrics
ASO is not a goal in itself. It is important to verify how new users influence retention and revenue. If installs are growing while retention is falling, it is possible that we are attracting the wrong audience. If organic LTV is below the target, it may be necessary to revise positioning on the storefront.
Analytics and Mobile App KPIs
In our measurement system, analytics must обязательно be the reference point. It is when we can use analytical tools to determine the effectiveness of our app. We evaluate not only ourselves, but also competitors, and how we look against them. The importance of the competitive field and the environment in which the app operates cannot be underestimated, especially when forming performance indicators.
How can analytical tools help us?
- Downloads and revenue are the main indicators of app performance.

- Featuring is one indicator that can be included in measuring the effectiveness of our work. After all, only the best apps get into store featured selections:

- Evaluating the effectiveness of ASO optimization is also extremely important when developing our own performance assessment system. Here you can use an entire pool of tools—from analyzing keywords and the semantic core to visibility and the level of installs from search queries. ASO Dashboard is well-suited for a more comprehensive and visually clear assessment:

A comprehensive evaluation of app performance is important: it provides an opportunity to assess the situation objectively and identify strengths and weaknesses. However, there is one caveat. When building a KPI system, you must understand that it should help improve your work. If development, tracking, and adjustment of indicators take up all our time, then we made the system too complex somewhere. We choose the most important indicators and use analytical tools that make the task as easy as possible.
Conclusion: Which KPIs Matter
From this entire list, our app needs no more than 5 KPIs right now—those tied to a specific goal. For one product, it is top-10 positions and CR. For another, it is the organic share and the LTV of new users.
ASO does not exist separately from the product. Installs are worthless if users leave after one day. Growth in visibility is useless if the page does not convert. All metrics work together, and the team’s job is to see this connection.
A good KPI is one that guides our decision: change the icon, rewrite the description, or dig deeper into the reviews. If the numbers simply sit in a dashboard, they have no meaning.
Optimize and evaluate results💙
FAQ: Frequently Asked Questions About Measuring ASO Effectiveness
Initial changes in visibility (keyword rankings and indexation) are usually noticeable within 1–3 weeks of metadata updates. Changes in store page conversion can typically be evaluated within 7–14 days, provided there is sufficient traffic volume.
However, sustainable impact — such as growth in organic share and influence on LTV — usually becomes visible within 1–3 months. ASO is not a one-time action; it is an iterative and systematic process.
For a new product, visibility is the priority.
The focus should be on:
- rankings for target keywords,
- the share of queries in the top 10,
- semantic indexation,
- the first organic installs.
Without stable visibility, it is premature to focus on conversion optimization or scaling organic growth.
Yes, and this is one of the most common situations.
Possible reasons include:
- a decline in store page conversion rate (CR),
- less relevant traffic,
- a drop in rating,
- increased competitive pressure.
That is why it is essential to analyze the full chain:
impressions → page views → CR → installs, rather than looking at metrics in isolation.
You should evaluate not only installs but also product metrics:
- Retention D1/D7/D30
- LTV of organic users
- ARPU
- Churn rate
If organic users retain or monetize worse than paid users do, your positioning or keyword strategy may need adjustment. Effective ASO is not just about increasing installs — it is about increasing installs that generate long-term business value.