A/B Testing in the App Store and Google Play: A Practical Guide
A/B tests are our way of making informed decisions in a world where every detail matters for app success. While some teams spend months arguing about which screenshot best conveys the essence of a product, others are already getting accurate answers from the most crucial authority — their users. A/B testing in ASO turns our assumptions and intuition into reliable data.
When competition is at its peak and store algorithms become increasingly autonomous, experimentation becomes incredibly important. Fortunately, we don’t need to reinvent the wheel — testing tools are already built into Google Play Console and App Store Connect, waiting for us to start using them. With these tools, we can establish a direct dialogue with our audience: ask questions, receive honest, real-time answers, and improve continually.
Let’s explore what A/B testing is and how to turn these tools into our main ally in the fight for conversions and visibility.
What Is A/B Testing
A/B testing is not just comparing two images. It is our way of having a conscious dialogue with the audience, where users “vote” with their installs and actions. Essentially, we ask them: “Which version of the page helps you understand the value of our app faster?” — and we receive a clear, measurable answer.
There are several formats for this dialogue. A split test is a fundamental approach that tests a single hypothesis — for example, comparing Icon A vs. Icon B to determine which attracts more attention. A multivariate test allows us to evaluate combinations of elements — we can test multiple screenshot sets, descriptions, and video previews at once to find the optimal combination. A product page experiment is a complete redesign that lets us create an alternative page version and measure how much more effective it is than the original.
But which elements should we test in 2025? The most effective ones are those that shape the first impression:
- The icon and first three screenshots — the visual anchors that catch the eye in the store
- Video preview — the 15 seconds that can convey value better than long descriptions
- Short description — what users see on the app page
- Visual sequence — the logical structure of the page that guides users from first impression to install: the first screen as the introduction, color accents as orientation points, and calls to action as the final step.
These are the elements users see within seconds of discovering our app — and they are the ones we must test first.
Why It Matters and Who Benefits
A/B testing goes beyond simply comparing versions — it becomes a coordinate system for the entire optimization process. Let’s explore the practical benefits for different specialists and where testing is most critical.
- Marketers gain validated creatives for ad campaigns and can apply successful findings across acquisition channels.
- ASO specialists improve metadata with precision, gradually increasing conversion rates.
- Developers learn which features and UI decisions resonate with users at first glance.
- UA teams use winning variants to improve ROI (Return On Investment) and scale practical approaches.
A/B tests are essential during key stages of an app’s lifecycle:
- First release — to choose the optimal product presentation strategy from the start
- A drop in conversion by 15%+ — a signal to urgently search for and test solutions
- App relaunch — to verify a new positioning concept
- Entering new markets — to culturally adapt content for local audiences
Testing before major updates is especially crucial — it’s our insurance against costly mistakes. Every successful experiment not only improves metrics but also builds a knowledge base about user preferences.
Preparing and Planning an A/B Test
Any successful experiment starts with thorough preparation. Before launching a test, we must clearly understand what we are testing, why, and how we will evaluate the outcome.
The foundation of any A/B test is a hypothesis. It should describe not only the change but the expected outcome. For example: “If we change the icon color from blue to orange, the page CTR will increase by 10% due to improved visibility in search results.”
Main rule: test one element at a time. If we change the icon, screenshots, and description simultaneously, we will never understand which change affected the result. We move step-by-step — from most important to secondary.
Accounting for external factors is equally important. The test period should include weekdays and weekends to avoid distortions caused by different user behavior patterns. We avoid launching tests during major holidays or advertising campaigns that may artificially alter traffic.
A properly planned test is already half the success. It allows us not just to collect data but to gather actionable insights for future improvements.
A/B Testing Process in Google Play
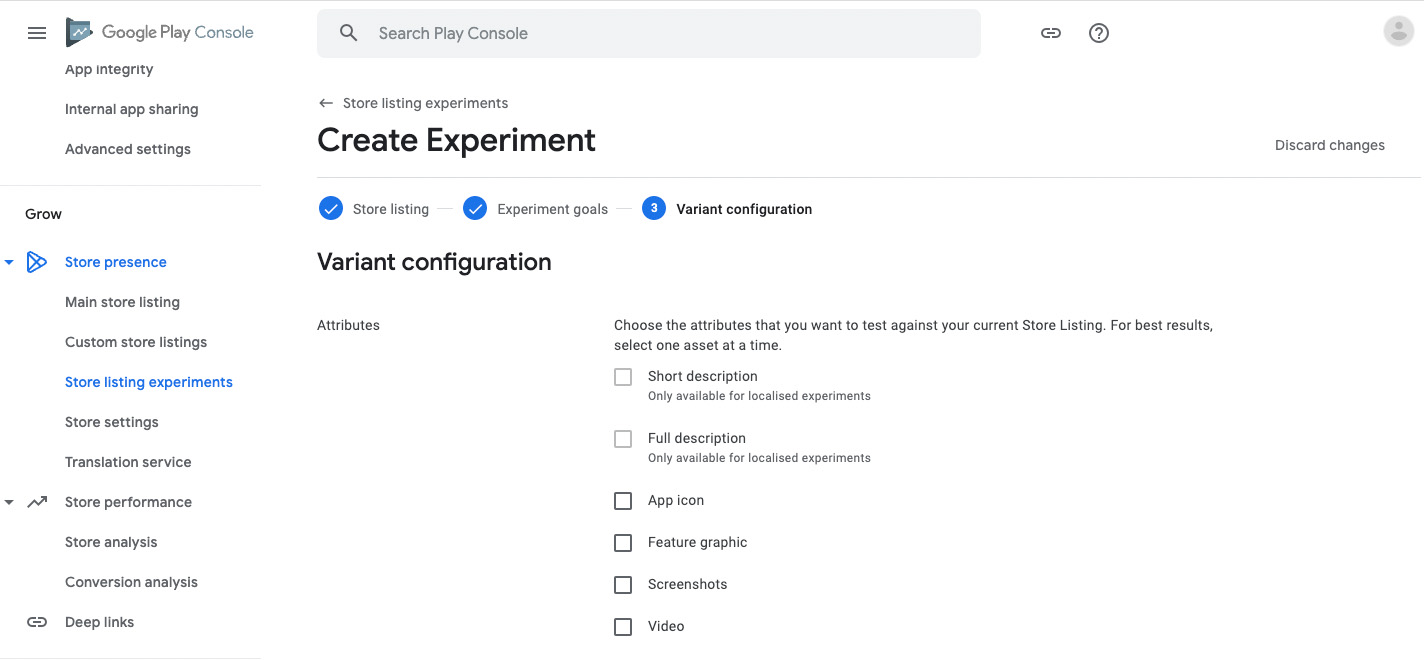
Google Play Console provides a powerful tool — Store Listing Experiments — that serves as a true laboratory for studying user preferences. Here we can test almost all page elements: screenshots, videos, descriptions, and graphics. The only major limitation is that app titles cannot be tested through this tool — they require a full app update.
To begin testing, open the Google Play Console, select the app, and navigate to “Growth”> “Store listing experiments.” This is where all Google Play A/B tests are created, including:
- default graphics experiment
Use this experiment to test graphic assets shown to a portion of all app page visitors.
- localized experiment
A localized experiment allows testing assets and descriptions among users who view the app page in a specific language. First, we add translations for the required languages. After this, we can run up to five localized experiments simultaneously.
- pricing experiment
Pricing experiments allow confident, precise price testing and adjustments based on purchasing power in different markets. Setting localized in-app product prices helps attract users with limited budgets.
The system supports up to three simultaneous page variants, which is especially valuable when working with multiple localizations. We can create separate experiments for different regions, adapting content to cultural specifics. The testing process takes time — typically 7–14 days — though formally Google Play does not impose a minimum duration; a test ends when statistical significance is reached.
The most significant advantage is that we receive precise, measurable results about which content truly resonates with our audience. The system automatically distributes traffic between variants and displays significance levels, helping us make data-driven decisions to improve our Google Play page.
A/B Testing Process in the App Store
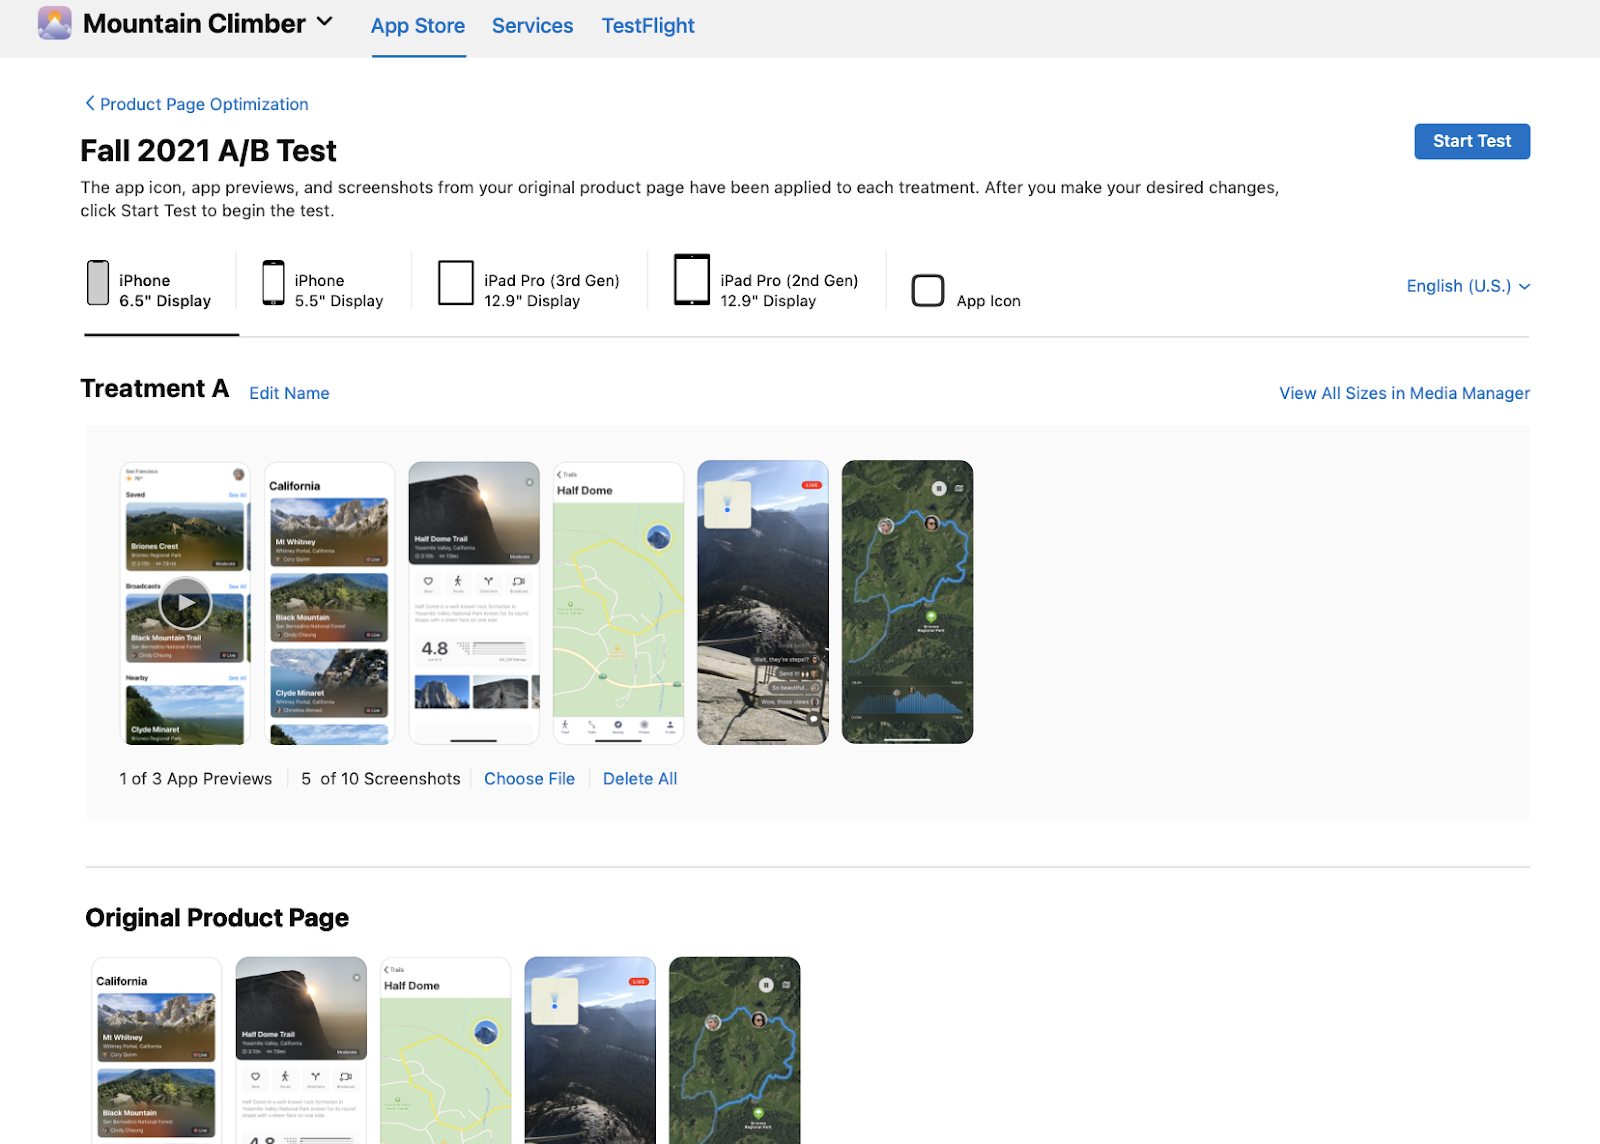
In App Store Connect, the tool for optimizing app pages is Product Page Optimization (PPO). To start, open App Store Connect, choose the app, and navigate to "Features" / "Product Page Optimization."
Apple has a unique requirement — each page variant must pass mandatory review, which takes about 2–3 days. We can test up to three alternative variants alongside the original page, allowing comparison of different content presentation approaches.
The testing period can last up to 90 days, providing enough time to collect statistically significant data even with moderate traffic. However, localization rules must be considered — tests must be configured separately for each language version.
After launch, the system automatically divides users across variants and provides detailed conversion analytics for each. This allows us to identify which design and content best resonates with the App Store audience before applying changes to the live product page.
| A/B Test Elements | App Store | Google Play |
| App Name | No | No |
App Icon | Yes | Yes |
| Screenshots | Yes | Yes |
| Video Preview | Yes | Yes |
| Subtitle | No | — |
| Short Description | — | Yes |
| Full Description | No | Yes |
| Number of Variants | Up to 3 | Up to 3 |
| Audience | Random organic user segment | Random segment of all page visitors |
| Test Duration | Up to 90 days | Recommended minimum 7 days |
| Requires Review | Yes | Yes |
| Localization | Yes | Yes |
Analyzing and Interpreting Results
Once the test is complete, the most critical stage begins — data analysis. A statistically significant result (usually with 95% confidence or higher) indicates that the difference between variants is not due to random variation, and we can trust the data.
Key metrics we examine:
- Conversion — how many users install the app after viewing the page
- CTR — how many users navigate to the app page from search results
- Retention — how long users stay after installation
Even “failed” variants can provide valuable insights. If Variant B performed worse on conversion but better on retention, it suggests it attracts a smaller but higher-quality audience. Every result reveals more about our users.
After finishing the test, we:
- Apply the winning variant as the main one
- Document the hypothesis and results in our knowledge base
- Create new hypotheses based on insights for future tests
A/B testing is a cyclical process — test, analyze, implement, test again — turning our ASO strategy into a constantly improving system. It brings our app closer to perfectly meeting user expectations and builds a strong foundation for long-term growth.
Common A/B Testing Mistakes
Even a well-designed experiment can become useless if we fall into typical traps. These pitfalls catch both beginners and experienced specialists — and the cost is wasted time and misleading conclusions.
- Prematurely stopping an A/B test is one of the most common mistakes. It’s important to understand that a fixed testing period (for example, 7–14 days) does not guarantee reliable results on its own. The key criterion is achieving statistical significance and collecting a sufficient sample size. If an app receives a high volume of traffic, the test may produce dependable results within just a few days. Conversely, even two weeks won’t help if the sample size remains too small. That’s why it’s essential to rely not on the duration of the test, but on significance metrics, the stability of the results, and statistical power calculators.
- Traffic imbalance between variants distorts outcomes. When one variant receives more users on specific days or at particular times, the experiment becomes biased. Automatic traffic distribution is our best ally here.
- External interference — running a test during a holiday or advertising campaign is like measuring temperature during a fire. You get data, but it says nothing about the actual impact of your changes.
- Cross-platform assumptions — believing a winning App Store variant will work the same in Google Play is dangerous. Platform audiences behave differently; what resonates with one may not work for the other.
By avoiding these mistakes, we can collect clean data that we can rely on when making important decisions for our app.
Practical Tips and Tools
To maximize the value of our tests, we must set the right priorities. The “impact/effort” matrix helps focus on what truly matters. High-impact, low-effort tests — such as modifying the first screenshot or the icon color — are the best place to start.
A/B Test Preparation Checklist:
- Formulated a clear hypothesis and defined the success metric
- Selected one element to test (the principle of single change)
- Checked platform requirements (App Store / Google Play)
- Set up proper traffic distribution between variants
- Included weekdays and weekends in the test period
- Excluded holidays and ad campaign periods
- Defined the minimum test duration
- Prepared a system for documenting results and insights
Automated analysis via Firebase and other analytics tools saves hours of routine work. They uncover correlations—for example, how changes to app pages affect long-term retention. Automatic reporting allows us to track progress without constant manual checks.
Visual localization requires more than just translation. Colors, gestures, symbols — all are perceived differently across cultures. What works in Europe may fail in Asia. Testing visual approaches for each region helps create a personalized experience for users worldwide.
Over time, these practices become a natural part of our workflow, enabling faster testing and more accurate results.
Conclusion
A/B testing is not a one-time action — it is an ongoing dialogue with our audience. Like a living organism, our app page must evolve constantly to keep pace with changing user preferences.
The most valuable aspect of this approach is the cumulative improvement effect. Each finished test serves as the foundation for the next, and even minor optimizations eventually lead to impressive results.
It is equally important to document each experiment, from hypothesis to conclusions. This knowledge base becomes a part of our corporate heritage, helping new team members understand decision logic and avoid repeating past mistakes.
We do not just follow trends — we generate data that empowers informed decisions and helps us move forward confidently in the competitive fight for user attention.
Test and Achieve Success 💙
A/B testing in ASO is a way to compare different versions of your app store page (icon, screenshots, descriptions, video, etc.) to see which one performs better with real users. Instead of relying on opinions or intuition, you run experiments in which traffic is split across variants, and users “vote” with installs and actions. This helps you make data-driven decisions, improve conversion, and better understand what your audience actually values.
The most impactful elements are the icon, the first screenshots, the video preview, and the short description, since they shape the user’s first impression.
A test usually runs for 7–14 days and continues until statistical significance is reached, ensuring reliable results.
In the App Store, each variant must pass review, and tests can run up to 90 days, while in Google Play, tests start instantly, don’t require review, and allow testing more elements, including descriptions and pricing.