Today, retention is the key question our mobile product must answer. It is no longer just a metric; it is the most important indicator of app health. A high install conversion rate loses its value when users leave before they understand our value. In the realities of 2026—with expensive traffic and limited data—the ability to retain an audience becomes our main asset. It is what turns rising acquisition costs (CPI) into predictable payback, rather than hope.
That’s why today we talk about retention not as a percentage of users returning after N days, but as a system for delivering repeatable value. This system consists of clear stages: show value quickly, repeat success, build a habit, and convert that habit into revenue. Each stage is a specific task. In this article, we’ll break this system down step by step: from how to measure what truly matters in the new conditions to concrete scenarios that turn churn statistics into an action plan.
Retention — start by defining the right metric
To speak the same language about retention, we need to start with the basics. The classic metrics everyone uses are D1, D7, and D30 retention. They show what percentage of users returned to the app on day 1, day 7, and day 30 after installation. Next to them, you’ll always see ARPU (average revenue per user) and LTV (the total amount of money a user brings over their lifetime). It sounds simple, but this is exactly where the main trap lies.
Without context, these numbers lose meaning because retention is relative and depends on the type of product. You can make two fatal mistakes:
Celebrate a high D7 while overlooking zero ARPU. This is the classic story of utility apps (e.g., a flashlight or a scanner). They are opened often, useful in a specific moment, but don’t generate revenue. There is retention, but there is no business.
Panic about a low D7 while ignoring a high LTV. This occurs in subscription services (e.g., fitness apps). A user may not open the app daily, but a stable monthly subscription fee is charged, generating strong long-term revenue.
It’s important to clarify one thing: D1/D7/D30 are excellent diagnostic markers, even though they are often called outdated today. They quickly answer the question of where exactly a drop-off appears along the user journey. But managing retention—and especially tying it to product economics—is more effective when using indicators that capture the business meaning of behavior, not a calendar date.
That’s why we suggest shifting the focus: keep D1/D7/D30 as diagnostic reference points, and group key metrics by business meaning. In the table below, we split the metrics into four categories:
| Category | Metric | Are we retaining revenue-generating users, and how effectively are we monetizing the active audience? |
| Survival (Onboarding) | Time to First Value — the time from opening the app to receiving the first user-obvious value. | Did the user reach the moment of value realization? If this path is too long, we will lose them forever. This is a critical stage for any app. |
| Engagement (Habit) | Active days over a period, depth of usage. | Has a habit formed, and how deeply is the product integrated into the user’s routine? |
| Monetization (Value) | Retention Paying Users (retention of payers), ARPDAU (average revenue per daily active user) | Are we retaining the users who generate revenue, and how effectively are we monetizing the active audience? |
| Forecast (Sustainability) | Predicted LTV, churn curves. | Long-term viability of the business model based on observed behavior patterns. |
This structure lets us move from the question What is our D7? to a more practical one: At which stage of the user journey are we losing people, and what should we do about it? And in most cases, you should start with Time to First Value—the metric that determines whether we give the user any reason to come back at all.
A quick prioritization tip: for most products, the logic is TTFAV → habit or engagement → retention of payers → revenue/LTV curves. If the user doesn’t see value quickly, any further discussion of monetization becomes theoretical.
Diagnostics — Retention Curve
Once we define which metrics matter for our business, we get numbers. But meaning comes from visual diagnostics. A retention curve (Retention Curve) is a clear map of a product’s problems and opportunities. It shows not only how many users returned but also how users left—highlighting weak points in their journey.
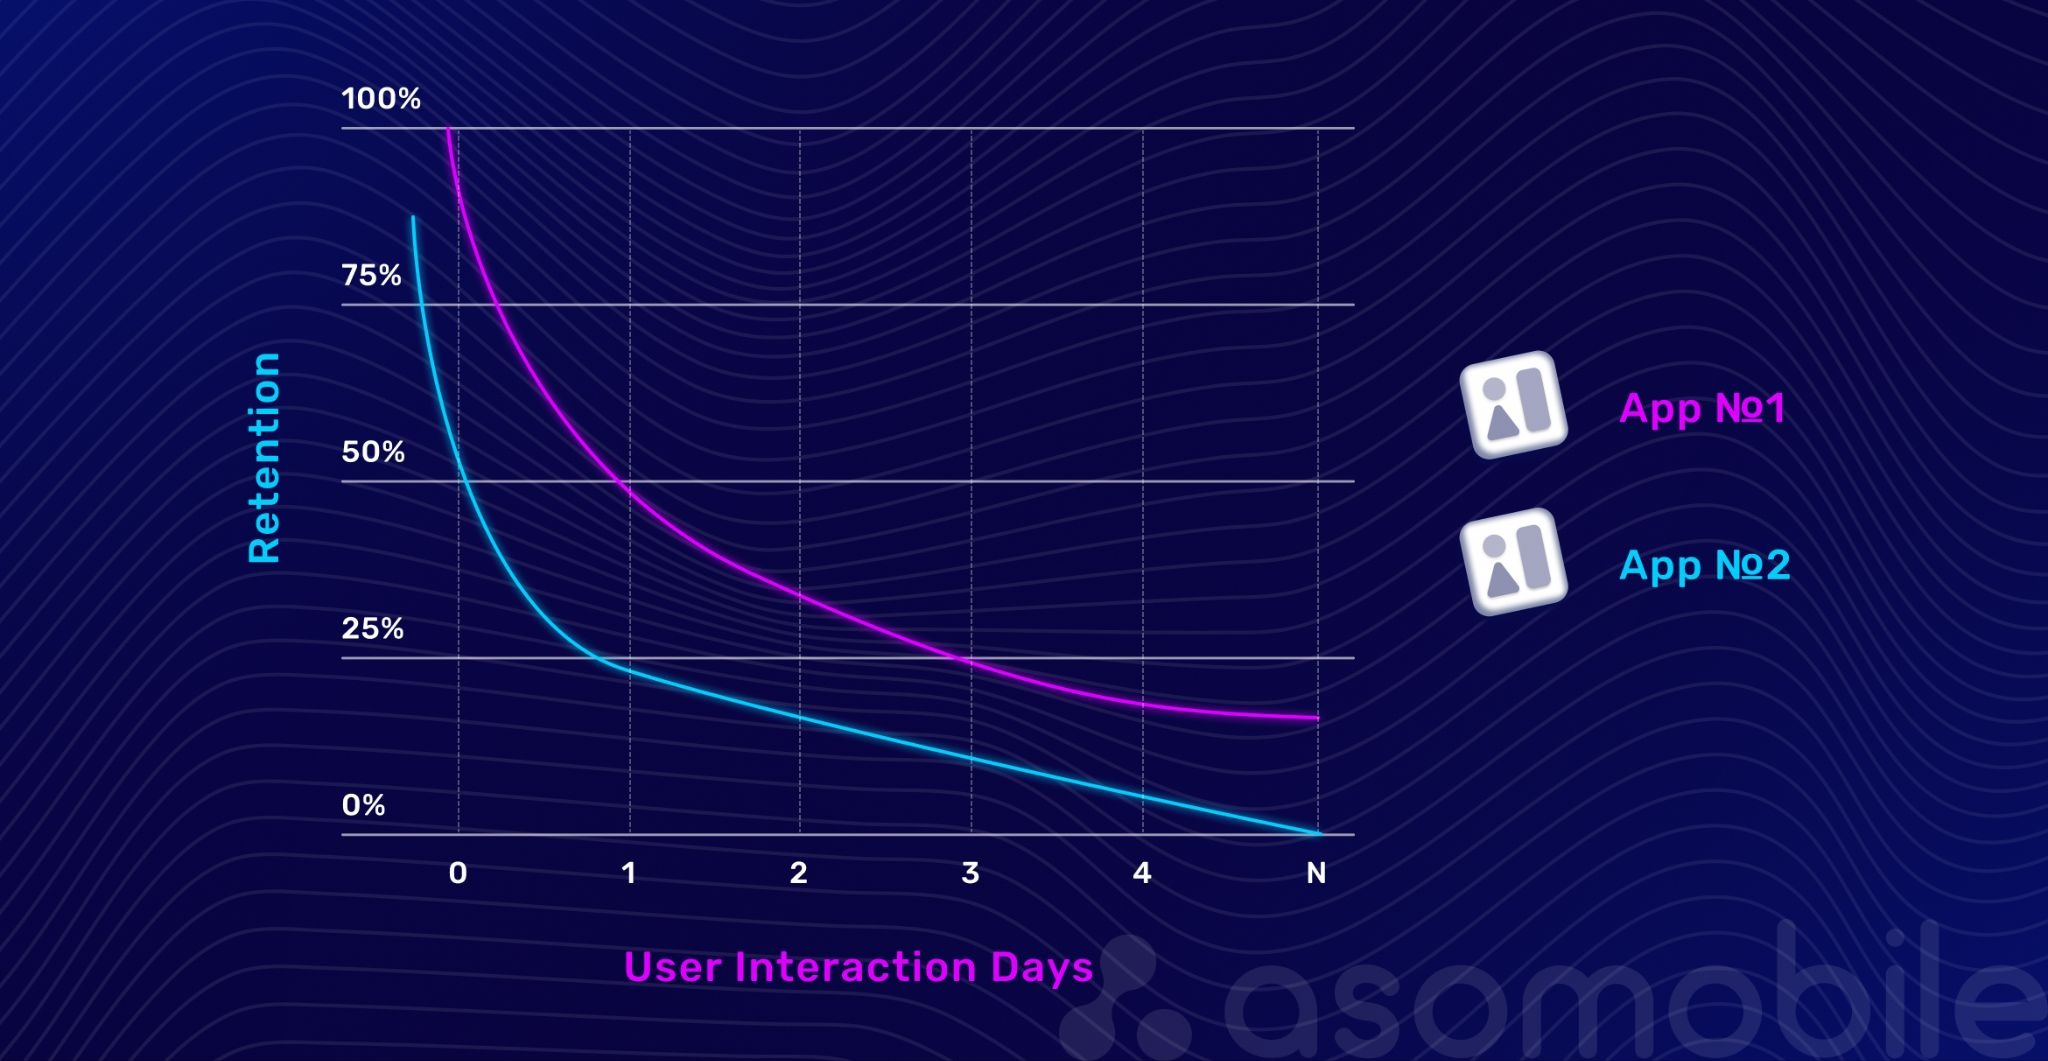
It’s important to see this curve not as a chart for the sake of a chart, but as a story—just told in percentages instead of words. Each typical shape has its own causes and financial implications: in one case, payback declines; in another, LTV becomes unpredictable; and in another, the product finally develops a stable core.
We highlight four typical curve shapes, each a signal for a specific team:
A cliff on D1. The curve drops sharply right after installation. This is a direct symptom of an onboarding failure or a weak first impression. The user didn’t reach the “aha” moment (TTFAV), and the value wasn’t demonstrated. Solution: Urgently simplify the first run.
Financial impact: acquisition spend burns on day one, CPI stops paying back, and payback becomes almost unreachable.
A gradual decline. Users return briefly but gradually forget the app. This is a sign of a weak habit loop. The product has no consistent reason to return. You need to design stronger triggers and rituals.
Financial impact: even if initial unit economics work, retention starts requiring more investment, and the payback period stretches.
Sharp spikes after campaigns or events. Activity jumps on communication days and then quickly declines. This is dependence on external prompts. There is no organic, internal motivation to open the app. You need to move value from one-off promotions into the everyday experience.
Financial impact: LTV becomes unstable—the product lives on bursts, and revenue forecasting turns into guesswork.
A stable plateau after the initial drop. After uninterested users churn out, a core remains—a group that returns consistently. This is the goal for any product. You can scale such a curve by increasing investment in acquiring similar audiences.
Financial impact: LTV is predictable, payback is manageable, and scaling becomes safer.
To turn observation into action, use this diagnostic checklist:
- Where is the biggest drop-off—on D1 (onboarding problem) or on D7 (retention problem)?
- Does churn happen before or after a key event (first purchase, completing the tutorial)?
- Does the retention picture align with revenue data? Does the payer retention curve mirror the overall curve, or does it have its own shape?
In this way, the retention curve serves as a guide to action, indicating which part of the value-delivery system has failed.
Analytics in the privacy era
The era of detailed user tracking is ending. Privacy restrictions and platform changes have dramatically reduced access to user-level data that product analytics relied on for a long time. Today, the main sources of information are SKAN and aggregated reports in Google Play Console and App Store Connect, where the focus is not on individual users but on cohort behavior. We no longer see one person’s path; we observe groups, as if looking at a city from above and losing sight of individual pedestrians.
This is an important shift in thinking. We ask less about what a specific person did and more about how users like this behave overall. In 2026, another reality was added: many datasets became modelled data, meaning probabilistic estimates. This doesn’t make analytics worse, but it requires discipline: we work with trends and patterns, not the illusion of absolute precision.
To make decisions in this new reality, we focus on three key methods:
Cohort-level analysis. This becomes the primary language. We group users by install week and observe how the whole group behaves over time. For example, we may see that the cohort from a specific ad campaign has a 15% higher retention rate on day 30. This signals to marketing, even if we don’t know exactly who stayed.
Finding proxy events. We replace simple, uninformative events, such as opening the app, with more meaningful ones that signal value received. For example, reached level 3, created the first project, and added three items to favorites. These events indirectly confirm that the user opened and used the app, and their aggregated cohort statistics serve as a reliable indicator.
Revenue cohort analysis. This is the gold standard under new conditions. We track how cumulative revenue (LTV) from a cohort changes over time. The curve shows that even if overall cohort retention declines, profitability remains stable because of monetizing a loyal core. Or it can reveal the opposite problem: people return but stop paying.
Conclusion: the focus shifts from tracking every user to understanding patterns in group behavior. We stop asking what the user did and start asking how a group of people who came from there behaves. This forces us to think more deeply about the product and audience segments, rather than simply optimizing tracking.
Lifecycle not by days, but by value
When we tie retention to calendar days, we make a fundamental mistake. We compare products and users across artificial frames that rarely align with real-life rhythms. Days 7 and 30 are just calendar markers. They are still useful as reference points, but retention management is more effective when organized around value stages.
So it’s more accurate to say this: we don’t reject time—we complement the time scale with a value-based lifecycle, a lifecycle built around five key stages of value delivery.
Imagine a user who has just installed the app. They don’t think about D7 and don’t know what LTV is. They are simply trying to understand whether the app is right for them. Each subsequent stage answers a new internal question.
First Value Moment: 30 seconds to 5 minutes.
The user consciously receives value from the product for the first time. This is the same TTFAV. The goal is to shorten the path to this moment as much as possible. In practice, it’s important to track the share of users who reach a key proxy event in the first session—that’s the best signal that value is truly delivered. If it fails: confusion, uninstall.
Repeat Value: 2–5 sessions.
The user returns to retrieve the same or a new value. They check whether the first success was accidental. Initial trust forms here. In practice, it’s useful to measure how many people repeat the key action in sessions 2–5—an early signal that the product is not a one-off.
If it fails, the impression is fleeting, the product is forgotten.
Habit Formation: integration into routine.
The product becomes a tool for solving a recurring task. The user returns not for a trial, but due to an internal need or trigger. Here, a good combination is active days per week and the WAU/MAU ratio, which shows how frequently the contact occurs.
If it fails: a gradual decline in the retention curve.
Monetized Value: willingness to pay.
The user is so convinced of the value that they are ready to pay for expanded access, convenience, or status. This doesn’t have to be a purchase—any revenue-generating action counts (ad views, subscription). Here, not only conversion to pay matters, but also context: when the person sees the paywall and how closely it is tied to value.
If it fails: high retention, low ARPU.
Long-term Value: loyalty and advocacy.
The product becomes part of the user’s identity. They not only pay, but also recommend it to others, forgive minor issues, and generate the highest LTV. Here it’s useful to look at revenue retention stability and behavioral signs of a core—for example, referrals or regular returns without external prompts.
Success signal: a loyal core formed.
What this looks like in practice for different categories:
- First Value for a fitness app: completed the first short workout.
- Repeat Value for a mobile game: played a few times to unlock a new character.
- Habit for a marketplace: checks the app for sales, uses it as a catalog.
- Monetized Value for a utility app: subscribed to remove ads, get offline access, or lift limits.
- Long-term Value for a music platform: creates playlists, follows artists, shares music with friends.
Segmentation and personalization
Once we adopt a value-based lifecycle model, we face its main consequence: if value is subjective, the path to it will differ for every user. Standard onboarding that pushes everyone through a single scenario often overlooks this, forcing users to navigate unnecessary steps to reach their goal. Instead of a fast, decisive moment, we risk creating irritation and losing interest.
Here, it’s important not to contradict the privacy era: in 2026, personalization is more often built not on a dossier about the user, but on cohorts and early behavioral patterns. We don’t have to know who they are to understand why they are here.
The key is proactive segmentation. Instead of splitting the audience after the fact based on completed actions, we can identify groups at the very first touch using subtler signals:
Intent-based segmentation: why is the user here? Is their motivation to solve a task immediately, explore features, or just be entertained? You can infer intent from the traffic source, the first action in the app, or the behavior pattern in the first seconds.
Monetization readiness: how predisposed is this user to purchase from the start? You can estimate this from the traffic source, the first UI interaction, or the session context.
What does this look like in a real product? Take a language-learning app. It can offer not one but three different entry paths:
- For a user who searched for "learn phrases for travel," we immediately show a micro-lesson, such as "How to order coffee." Their path is quick practical value.
- For someone who installed the app after seeing an ad, we offer an interactive tour of features and let them choose a topic they like. Their path is exploration.
- For a user who came from a campaign about a subscription with expanded access, after the first exercise is completed, we gently show which premium unlocks are available. Their path is designed from the start with conversion in mind.
The same logic defines ongoing communications. A trigger for a push notification to a user who abandoned a cart might be a reminder about the item or a personalized discount. For a user who completes ten lessons in a row, it might be a congratulatory message and unlocking a new section. Personalization becomes not a campaign, but a product state.
All of this requires following a simple but strict rule: One-action onboarding. In the first 30 seconds, the user should complete one maximally relevant key action that directly leads to value realization. Not profile setup, but getting the first result. At the same time, for complex products, this may not be a single tap, but a logically complete step that produces a tangible result and reinforces the feeling: "Okay, this works."
Playbook for solving common problems
When we run diagnostics on the retention curve, it identifies the weak spot. The next step is to apply a concrete set of actions to fix it. And sequence matters: in most cases, you should start with the First Value Moment, because without value in the first session, improvements at later stages will have a weak effect.
Here are three ready-made scenarios for the most common problems teams face:
Playbook 1: Low D1 retention
Hypothesis: the user didn’t see the value or faced too high a barrier at the start. The value-delivery system failed at the very first stage—the First Value Moment.
What to do:
- Simplify the first run. Minimize required steps (signup, permissions) to the absolute minimum. Allow anonymous use or a guest mode. Goal: get the user to the action in three taps.
- Visualize the benefit immediately. Don’t talk about capabilities—let users feel them right away. For example, in a photo editor, apply an instant default enhancement.
- Ask the right question. Instead of What’s your name? ask What task do you want to solve? The answer becomes the basis for instant personal path customization.
Playbook 2: High retention, low ARPU (retention without money)
Hypothesis: the habit loop is formed, but there’s no clear link between received value and willingness to pay.
What to do:
- Strengthen premium value inside the free experience. Don’t just list features—demonstrate them. For example, give temporary access to a premium template or show what the solution would look like with a subscription.
- Segment by willingness to pay. Focus efforts on the segment with high monetization potential by offering targeted upgrade scenarios, and for everyone else, strengthen the core value to increase loyalty and long-term LTV.
- A/B test timing and format of payment. Test not only price, but context: offer a subscription right after a success moment or at the point where the user hits a free-feature limit.
Playbook 3: Massive churn after the trial ends
Hypothesis: the trial period didn’t convince the user of the product’s long-term value. Either the value wasn’t strong enough, or it wasn’t demonstrated properly. The user didn’t move from Repeat Value to Monetized Value.
What to do:
- Design the trial as a dense tour of key wow moments. Don’t give full access to everything for 14 days. Instead, create a 3–5-day guided scenario that guides the user from one key feature to the next.
- Remind users of benefits before the trial ends. Launch a series of communications (push, email) 2–3 days before expiration: not just a date reminder, but a short summary of value already received.
- Offer flexible terms after the trial. Plan a soft landing: keep access to key functionality with volume limits, or offer a hybrid model with microtransactions.
These scenarios turn abstract low retention into a sequence of concrete experiments. Each one tests a hypothesis about how to improve value delivery for a user at a specific stage of their journey.
Practical tools and tactics
Retention is not only a strategy, but a daily practice. These tools act as levers, helping gently guide the user to the next step and reminding them of the product’s value.
It helps to keep a simple map in mind:
First/Repeat Value — in-app guidance and welcome sequences;
Habit — trigger-based communications and recurring content;
Monetized Value — paywall experiments and premium value demonstrations;
Long-term Value — loyalty, status tiers, referrals, and social mechanics.
Push notifications that wait for the right moment
- Behavior triggers: abandoned cart, completed level, and several days of leaving no activity.
- Personalization: name, action history, context (You viewed this item—now it’s discounted).
- Deep links and tests: copy, send time, links to the exact screen.
Email sequences that guide users step by step
- Welcome sequence: 2–3 emails that lead to the core value in the first days.
- Re-engagement for dormant users: a bonus or incentive to return after 7–14 days of inactivity.
- Educational materials: guides and cases that unlock more value from the product.
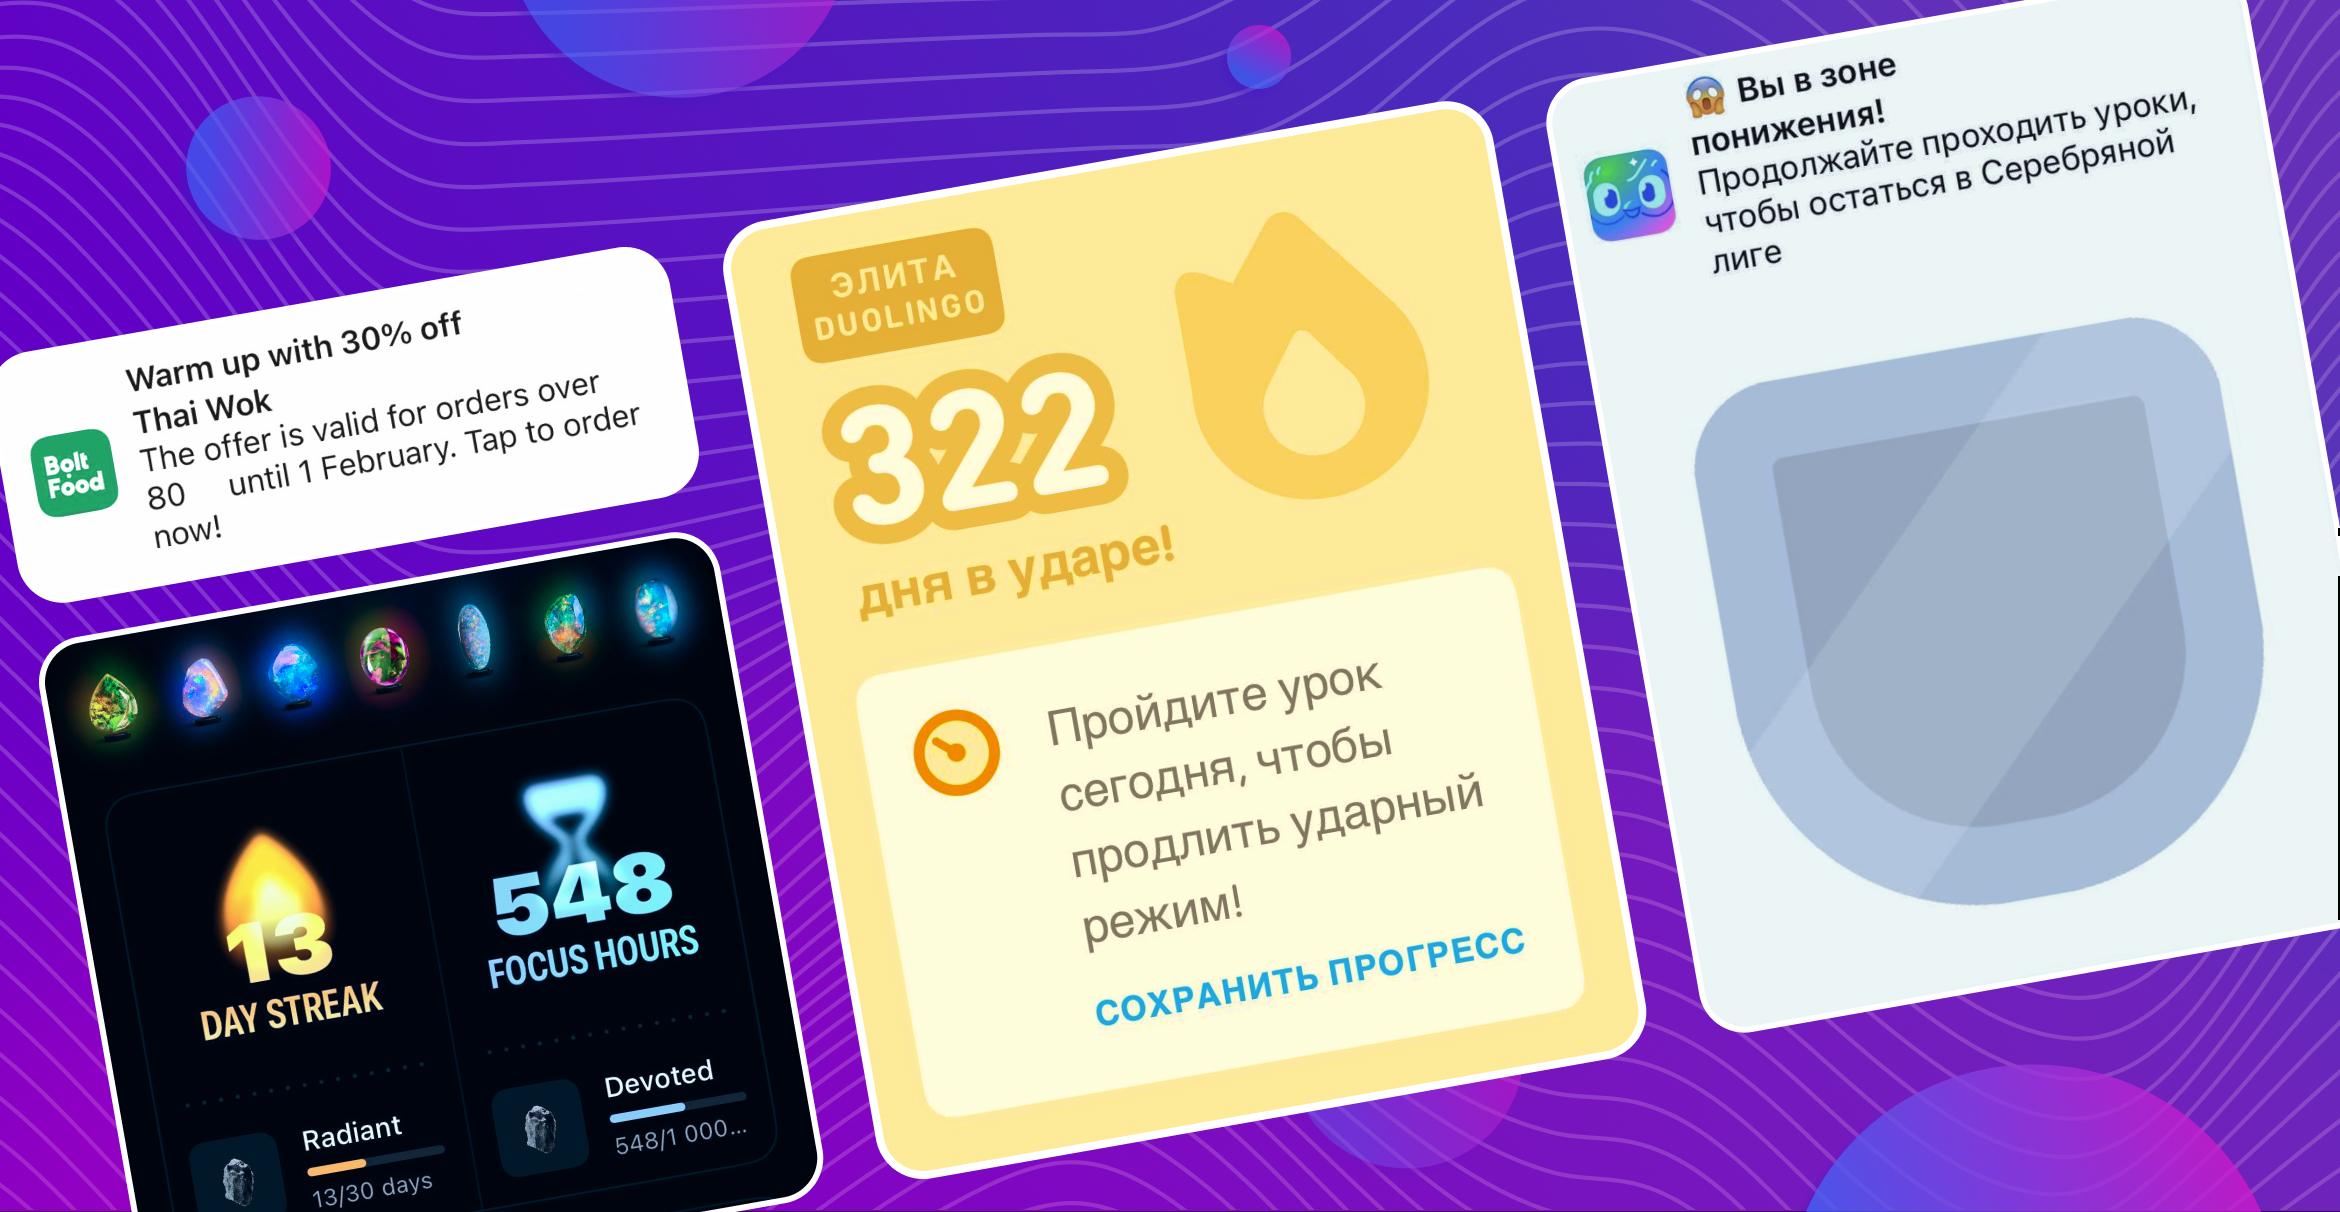
Loyalty and gamification mechanics
- Progress system: rewards, streaks, achievement visualization.
- Status tiers: exclusive benefits for active users.
- Referral programs: rewards for inviting friends.
In-product content as a reason to return
- Personalized recommendations: For you, Continue, Similar.
- Living content: daily picks, challenges, updates.
- Social elements: leaderboards, profiles, and sharing.
Event rhythm and product development
- Limited-time events: seasonality and urgency.
- Regular updates: a reason to return even for the core.
- Involving users in development: surveys and voting.
It’s important to understand one thing: none of these tools retains users by itself. Push notifications, email sequences, gamification, or content are not standalone solutions—they are amplifiers. They either speed up value delivery or conceal its absence.
If the user doesn’t understand why they need the product, a notification will only accelerate uninstallation. If a value exists but isn’t embedded into a routine, communications help form a habit. If a habit exists but isn’t tied to revenue, tools help identify the right moment to monetize.
Effective retention work is not a set of disconnected mechanics but a deliberate choice of levers for a specific stage of the user lifecycle. We don’t act for the sake of metrics or formal indicators. We use tools that amplify product value, not replace it.
At that point, tactics stop being noise and start driving retention growth, LTV, and overall business sustainability.
Conclusion
Retention is not just a D7 percentage; it's a working system for delivering repeatable value. We explored why classic metrics without context are misleading, learned to read retention curves as a map of problems, and reviewed tools that help operate in the privacy era.
This approach helps us act with precision rather than guess. We start with the weakest point—whether onboarding, the post-trial moment, or user retention—and run experiments to improve a specific transition within the lifecycle.
Key takeaways:
- Retention is a system, not a return percentage.
- The main growth levers are Time to First Value and Repeat Value.
- In a privacy-first reality, winning teams think in cohorts and revenue, not perfect tracking.
- We improve not everything at once, but the most critical transition—and that’s how we build a sustainable growth foundation for a mobile app.
User acquisition is no longer a competitive advantage: traffic is getting more expensive, and data is becoming less precise. Without retention, even a high install conversion does not pay off. Retention turns marketing spend into predictable revenue, shortens payback periods, and directly impacts LTV.
D1, D7, and D30 are still useful for diagnostics, but sustainable growth is driven by value-based metrics. The key one is Time to First Value, which shows whether users actually reach meaningful value. Beyond that, teams should focus on habit formation metrics, retention of paying users, and revenue cohort dynamics.
The focus has shifted to cohort analysis, proxy events, and revenue cohorts. Instead of tracking individual users, teams analyze group behavior and make decisions based on stable patterns and trends rather than precise user-level data.
In most cases, the starting point is the First Value Moment. If users do not experience clear value within the first few minutes, improvements to onboarding, messaging, or monetization will have little impact. Retention should be improved incrementally, focusing on the weakest transition in the user lifecycle.